BMI Visual Graph
Our bodies come in different shapes and sizes and as such weight alone is not a good indicator of our health and fat levels. The Body Mass Index (BMI) is a much better way of evaluating your fat as it takes into account your height in addition to your weight.
Say for example, a person who is 6ft tall and 78kg. They could be considered very healthy, whereas a person who is 5ft tall weighing 78kg would be considered obese to the degree that they may face serious health risks as a result. The same amount of weight cannot be carried by a person who is significantly shorter and would indicate a much higher fat percentage.
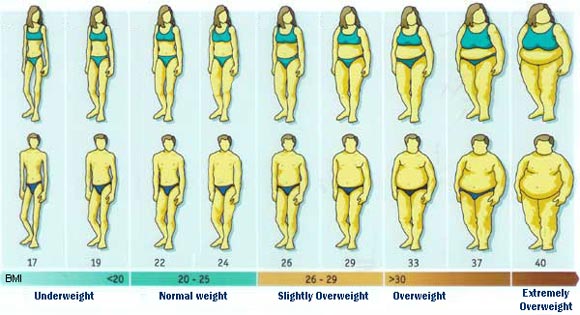
The Pictures BMI graph takes the approach of the Body Mass Index, while providing us with a graphical indicator of what the numbers mean in terms of our body appearance. After all, as useful as numbers are, the way we look is one of the most helpful tools in assessing our health and weight.
It is also often a strong driving force behind reaching/sustaining our healthy weight, so to have an idea of how bodies look at different BMIs is useful in that respect also.
The use of pictures against the numbers of the Body Mass Index is a good representation of how different ranges result in different shapes and the carrying of weight. If you find your body mass index and the corresponding body shape is similar to your own, then you can see what affect an increase or decrease in your BMI will have on your body.
If your body shape is slightly different to the corresponding picture, the progression in photos is still a very good indictor of how changes in your BMI will affect fat increase and distribution.
For more information on BMI